Effortless Scaling and Deployment: A Comprehensive Guide for Solo Developers and Time-Savers

This article is designed for you if you value producing high-performance applications quickly and effectively, without the hassle of setting up complicated environments. This in-depth guide will explore techniques and tools that make the process more efficient, allowing you to concentrate on what really matters: developing and deploying your applications with ease and assurance. Let’s explore containerization, orchestration, and scaling together as you sit back and unwind.
Applications that are scalable, effective, and dynamic are more necessary than ever in the fast-paced world of today. Containerization and orchestration using Docker Compose and Traefik are two common methods for accomplishing this. With Traefik acting as a reverse proxy and load balancer, this article offers a thorough overview of scaling Docker Compose services. We will go over the fundamentals of Traefik and Docker Compose before delving into service scaling, load balancing, and monitoring.
What is Docker Compose?
Using a straightforward YAML file, Docker Compose is a tool for creating and running multi-container Docker applications. It enables programmers to quickly configure, create, and deploy intricate applications with numerous connected services.
version: '3'

services:
  web:
    image: my-web-app:latest
    ports:
      - "80:80"
Key Features
- Simplified service management
- Declarative configuration
- Network and volume management
- Multi-host deployment
What is Traefik?
An open-source reverse proxy and load balancer with modern, dynamic features, Traefik is made to handle containerized applications. It provides HTTPS support, automated configuration, and a strong observability stack.

Key Features
- Dynamic configuration
- Auto-discovery of services
- Load balancing and failover
- Metrics and monitoring
Service Scaling with Docker Compose and Traefik:
In Docker Compose, scaling a service entails changing the number of replicas (instances) of a service to accommodate a growing load. Incoming requests are distributed to the available replicas by Traefik, which serves as a reverse proxy and load balancer, ensuring high availability and effective resource utilization.
Steps to Scale Services
- Define services in the Docker Compose file
- Configure Traefik as the reverse proxy
- Use labels to expose services to Traefik
- Set up load balancing strategies
- Monitor and adjust service scaling
Load Balancing Strategies:
- Round Robin: A simple, evenly-distributed load balancing strategy. Incoming requests are distributed in a circular order across all available service instances.
- Weighted Round Robin: Similar to Round Robin, but allows assigning weights to services based on their capacity. Services with higher weights receive more requests.
- Least Connections: Distributes requests to the service with the fewest active connections, ensuring more even load distribution.
- Random: Selects a service instance randomly for each incoming request.
Scaling a service using traefik and docker compose:
Our main objective at ProPro Productions is to develop extremely effective applications that meet the needs of our customers. We’ll use a practical example from our staging environment to give a thorough explanation of how you can scale your services effectively. By guiding you through this practical scenario, we hope to give you the information and understanding you need to put practical scaling techniques into practice for your own applications. So let’s get started and discover how ProPro Productions uses orchestration and containerization to achieve the highest levels of performance and scalability.
Consider the following docker-compose.yml file
version: '3.8'
services:
  server:
    extra_hosts:
      - host.docker.internal:host-gateway
    restart: always
    build:
      context: .
      dockerfile: ./compose/local/server/Dockerfile
    env_file:
      - ./.envs/.production/.server
      - ./.envs/.local/.redis
      - ./.envs/.local/.computations
    networks:
      - proxy
      - backend
    volumes:
      - server_logs:/var/log/server
    labels:
      - 'traefik.enable=true'
      - 'traefik.docker.network=backend'
      - 'traefik.http.routers.server-secure.entrypoints=websecure'
      - 'traefik.http.routers.server-secure.rule=Host(`server.domain.io`)'
      - 'traefik.http.routers.server-secure.service=server'
      - 'traefik.http.services.server.loadbalancer.server.port=8080'
    logging:
      driver: 'json-file'
      options:
        max-size: '200k'
        max-file: '10'

  computations:
    restart: always
    extra_hosts:
      - host.docker.internal:host-gateway
    labels:
      - 'traefik.enable=true'
      - 'traefik.docker.network=backend'
      - 'traefik.http.routers.computations-secure.entrypoints=websecure'
      - 'traefik.http.routers.computations-secure.rule=Host(`computations.domain.io`)
      - 'traefik.http.routers.computations-secure.service=computations'
      - 'traefik.http.services.computations.loadbalancer.server.port=7001'
    build:
      context: .
      dockerfile: ./computations/Dockerfile
    volumes:
      - computations_logs:/var/log/computations
    depends_on:
      - server
    networks:
      - proxy
      - backend
    env_file:
      - ./.envs/.production/.server
      - ./.envs/.local/.redis
      - ./.envs/.local/.computations

  traefik:
    image: traefik:latest
    extra_hosts:
      - host.docker.internal:host-gateway
    container_name: traefik
    restart: unless-stopped
    security_opt:
      - no-new-privileges:true
    networks:
      - proxy
      - backend
    ports:
      - 80:80
      - 443:443
    volumes:
      - /etc/localtime:/etc/localtime:ro
      - /var/run/docker.sock:/var/run/docker.sock:ro
      - ./compose/production/traefik/traefik.yml:/traefik.yml
      - ./compose/production/traefik/acme.json:/acme.json
      - ./compose/production/traefik/configurations:/configurations
      - traefik_logs:/var/log/traefik
    labels:
      - 'traefik.enable=true'
      - 'traefik.docker.network=backend'
      - 'traefik.http.routers.traefik-secure.entrypoints=websecure'
      - 'traefik.http.routers.traefik-secure.rule=Host(`proxy.ourDomain.io`)'
      - 'traefik.http.routers.traefik-secure.middlewares=user-auth@file'
      - 'traefik.http.routers.traefik-secure.service=api@internal'
    logging:
      driver: 'json-file'
      options:
        max-size: '200k'
        max-file: '10'

volumes:
  data:
    driver: local
  server_logs:
    driver: local
  computations_logs:
    driver: local
  traefik_logs:
    driver: local

networks:
  proxy:
    external: true
  backend:
    driver: bridge
    name: backend
We have a configuration file that defines a multi-container application with three services: server, computations, and traefik. Let's break down the key components of this configuration file.
Docker Compose — scale Command:
The docker-compose --scale command allows you to scale your Docker Compose services by specifying the number of replicas (instances) for each service. This command makes it easy to scale services up or down on demand.
docker-compose up --scale SERVICE=NUM_REPLICASTo both services, we can simply run
docker-compose up --build --scale server=3 --scale computations=3If we run this, we can see something like this
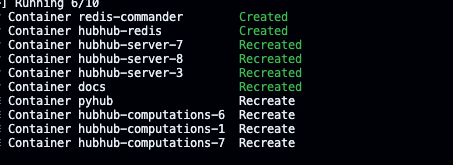
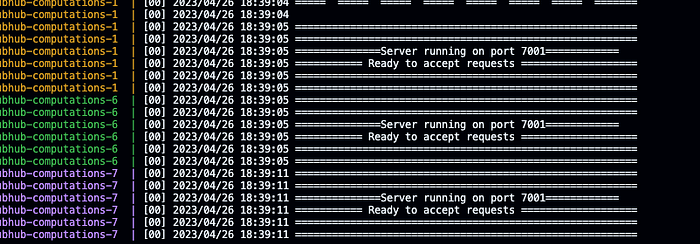
We have 3 instances of computations and 3 instances of the server

You can see how we are now running 3 instances of each service that we scale.
Load Balancing Strategy
By default, Traefik uses the Round Robin load balancing strategy, but you can change this by adding the appropriate label to your service. For example, to use the Weighted Round Robin strategy, you would add:
labels:
  - "traefik.http.services.web.loadbalancer.method=wrr"
But without changing anything. Traefik will automatically discover the new instances of your computations and serverservice and load balance incoming requests.
Sticky Sessions
To enable sticky sessions, which ensure that a client’s requests are routed to the same instance of a service, add the following label to your service:
labels:
  - "traefik.http.services.computations.loadbalancer.sticky.cookie=true"
Health Checks
To add health checks, which allow Traefik to route traffic only to healthy instances, add the following labels to your service:
labels:
  - "traefik.http.services.computations.loadbalancer.healthcheck.path=/health"
  - "traefik.http.services.computations.loadbalancer.healthcheck.interval=10s"
Monitoring Traefik
Traefik provides built-in support for monitoring and observability tools like Prometheus, Grafana, and Jaeger. To enable metrics collection in Traefik, you need to configure an additional service, such as Prometheus. Add the following lines to the Traefik command section in your `docker-compose.yml` file:
- "--metrics.prometheus=true"
- "--metrics.prometheus.buckets=0.1,0.3,1.2,5.0"
Adding Prometheus as a Service
Add a new Prometheus service to your docker-compose.yml file to collect metrics from Traefik:
services:
  ...
    prometheus:
    image: prom/prometheus:latest
    volumes:
      - ./prometheus.yml:/etc/prometheus/prometheus.yml
    command:
      - '--config.file=/etc/prometheus/prometheus.yml'
    ports:
      - '9090:9090'
    labels:
      - 'traefik.enable=true'
      - 'traefik.docker.network=backend'
      - 'traefik.http.routers.prometheus-secure.entrypoints=websecure'
      - 'traefik.http.routers.prometheus-secure.rule=Host(`prometheus.example.com`)'
      - 'traefik.http.routers.prometheus-secure.service=prometheus'
      - 'traefik.http.services.prometheus.loadbalancer.server.port=9090'
    networks:
      - proxy
      - backend
Create a prometheus.yml configuration file to scrape metrics from Traefik:
global:
  scrape_interval: 15s

scrape_configs:
  - job_name: 'traefik'
    static_configs:
      - targets: ['traefik:80']
Visualizing Metrics with Grafana
Add Grafana as a service in your docker-compose.yml file to visualize metrics collected by Prometheus:
services:
  ...
  grafana:
  image: grafana/grafana:latest
  labels:
    - 'traefik.enable=true'
    - 'traefik.docker.network=backend'
    - 'traefik.http.routers.grafana-secure.entrypoints=websecure'
    - 'traefik.http.routers.grafana-secure.rule=Host(`grafana.domain.com`)'
    - 'traefik.http.routers.grafana-secure.service=grafana'
    - 'traefik.http.services.grafana.loadbalancer.server.port=3000'
  networks:
    - proxy
    - backend
Once Grafana is running, access it at https://grafana.domain.com ,or you can use your traefik to reverse traffic to Grafana on production. Add Prometheus as a data source, and create a dashboard to visualize the metrics.
This comprehensive guide has covered how to scale services using the docker-compose --scale command and use Traefik for load balancing. Along with details on how to monitor your setup using Prometheus and Grafana, we have also offered code examples for various configurations and tactics. With this information, you can effectively scale your services for maximum effectiveness and resource efficiency.